
As global emissions of greenhouse gas continue to rise, it is increasingly important for researchers and policymakers to identify exactly where and how much greenhouse gas is emitted and absorbed worldwide for global climate change mitigation. Over the past decade, Dr. Tomohiro Oda of the Universities Space Research Association (USRA) in Maryland has aimed to realize this need by combining emission data with night-time observations from satellites. Through this work, his team has now produced global maps that distinguish sources of carbon at unprecedented resolutions – high enough to identify variation across the regions where emissions are most intense: Earth’s cities.
Monitoring with Accuracy
As the urgency of humanity’s need to tackle climate change becomes increasingly apparent, it has never been more critical for us to monitor our emissions of carbon dioxide (CO2) – the most significant greenhouse gas emitted due to human activity – with pinpoint accuracy.
The technology required to support this has seen significant improvements over the past decade, both on the ground and in space. While intricate sensor networks have allowed some businesses and governments to accurately quantify their emissions, carbon-observing satellites, including the Greenhouse gases Observing SATellite (GOSAT), developed by Japanese space agencies and NASA’s Orbiting Carbon Observatory-2 (OCO-2) sensor, have given researchers an improved perspective on CO2 sources, as well as ‘sinks’, where the gas is taken out of the atmosphere, and absorbed by plants and the ocean.
Despite these advances, however, the detection capabilities of these current monitoring techniques are not at their full capacity and require further improvement. The main challenge they face is that sources of CO2 can be hugely diverse. Ranging from forest fires to road traffic, they can vary depending on the time of day or year and can be located across regions of vastly different sizes. So far, the many difficulties presented by this diversity have prevented climate scientists from gaining a clear enough picture of emission sources to keep track of their emissions – particularly in more densely populated regions.
The Problem with Urban Emissions
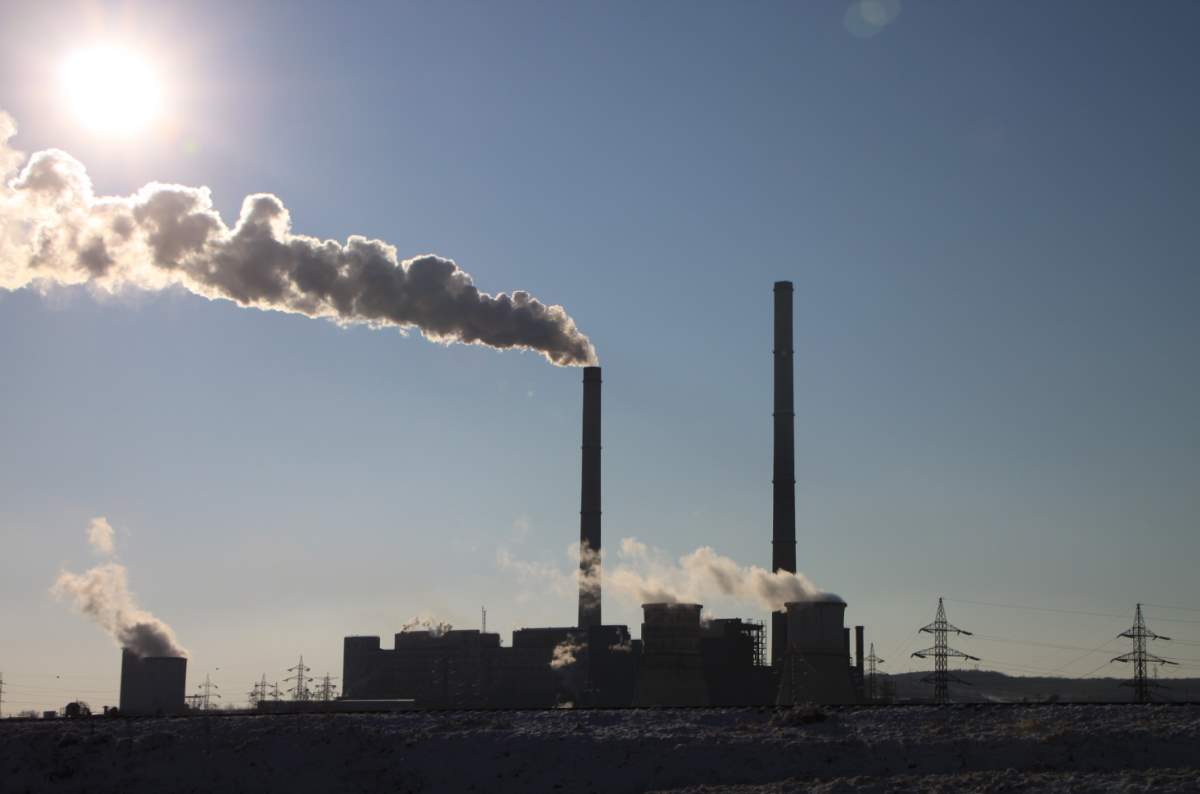
Currently, the world’s cities are responsible for around 70% of all CO2 emissions globally. With their dense populations, they must concentrate on carbon-intensive activities including power generation, industry, transport, and the heating and cooling of buildings in small areas.
As urbanization brings an even higher proportion of the population into cities, it would initially seem that these emissions can only be expected to rise. However, the increasingly urgent calls to reverse this trend are now beginning to be shared with scientists and a growing number of city governments worldwide. From expansions of public transport to greener manufacturing techniques, meaningful efforts for climate change mitigation supported by science are now taking root.

Central to each of these schemes is the ability of local governments to track how their cities’ greenhouse gas emissions are changing over time. In many cities, however, shortcomings in data collection methodologies, as well as the limited quality of the data itself, mean that these inventories are not always detailed enough to support decision-making. At the same time, the observations of space-based CO2 detectors, which can capture the emissions of entire cities over extended periods, do not yet have the capability to directly monitor individual sources in cities.
Ultimately, since no single technique appears to be effective in monitoring Earth’s most intense CO2-emitting regions on its own, the key for achieving monitoring of global cities’ emissions is to fuse the emission inventories and space-based observations of CO2.

Mapping Cities’ Carbon Emissions: Combining Data
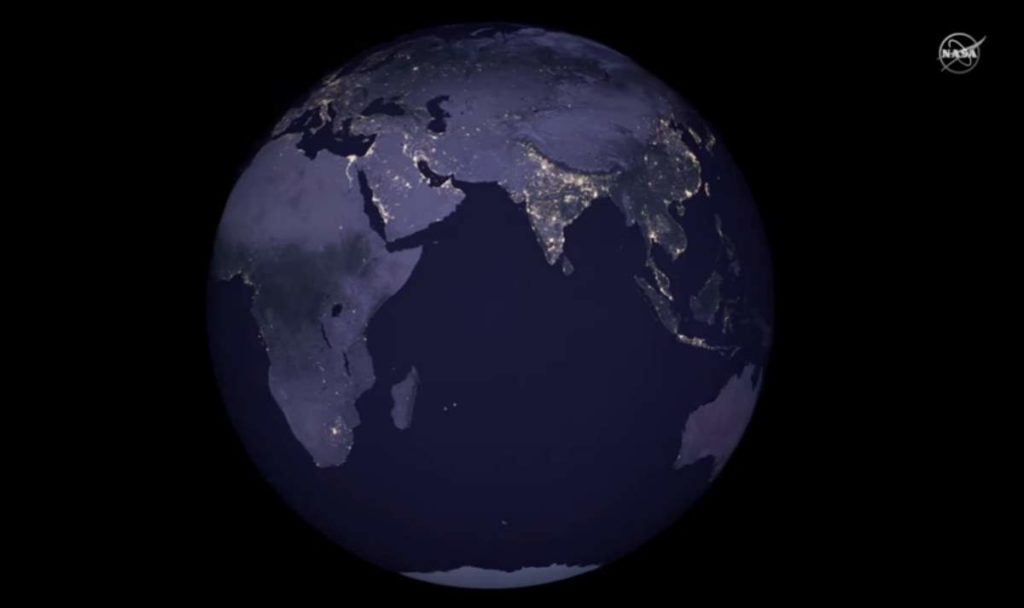
In a 2011 study, Dr. Tomohiro Oda, then working on the GOSAT project at the National Institute of Environmental Studies (NIES) in Japan, reported on an improved CO2 emission mapping technique by combining emission estimates for countries with another seemingly unrelated dataset: satellite observations of night-time lights.
His team mapped out the likely sources of these emissions by correlating them with a specialized dataset of night-time lights, which could distinguish between the brightest features of individual cities. The rationale behind this was simple: the brightest parts of cities, including roads, factories, and dense commercial districts, are typically the most intensive CO2-emitting regions. Power plant emissions, which are typically very large but not correlated with population, were mapped using other data sources.
This technique enabled Dr. Oda’s team not only to create the yearly emission maps of individual countries but to pinpoint the exact locations of potential emission sources down to resolutions of just one square kilometer. This resulted in a grid spanning the entire globe, with each square representing one square kilometer. Compared with more traditional mapping techniques, this procedure gave the researchers far more information about areas corresponding to human settlement and land transport.
Improvements Through ODIAC
The advances brought about by Dr. Oda’s previous research culminated in the Open-source Data Inventory for Anthropogenic CO2 (ODIAC), developed at NIES, in collaboration with co-founder Dr. Shamil Maksyutov. ODIAC used a combination of emission data with global night-time light observations to intricately map the intensities and locations of CO2 sources worldwide.
This technique produced a worldwide grid of square-kilometer sources. Yet unlike previous global-scale maps created from similar approaches, individual cities displayed their own characteristic shapes and structures, based solely on their CO2 emissions. In addition, the method could distinguish between sources created by the combustion of different types of fuel, and between different activities, including gas flaring and aviation.
In more recent years, the researchers tested a variant of ODIAC to reliably map the sources of all CO2 emitted by many global cities across different continents, including Los Angeles, London, Tokyo, Bangkok, Cape Town, and Beijing. Dr. Oda and his colleagues have also developed an extended geospatial modeling approach to map emissions down to even higher resolutions, creating a grid with squares just 30 meters across to resolve emissions at the scale of human activities. By combining ODIAC’s estimations with observations and models, the team could even track characteristic variations in emissions over time.
Such intricate detail would have only been possible for cities that benefit from dense networks of accurate CO2 sensors, allowing for extensive data collection. However, Dr. Oda’s latest research, as well as an upcoming satellite mission, promises to bring about monitoring techniques that can be applied far more generally.
Upcoming Measurements with OCO-3
Since the success of these studies, Dr. Oda has aimed to push the capabilities of his monitoring techniques even further, with the help of NASA’s OCO-2 instrument, which was launched in 2014. Using the most cutting-edge CO2 observing techniques available, OCO-2 has provided researchers with vital emission data over the past several years.
However, OCO-2 has frequently missed its observation targets due to its fixed narrow range of vision. As the instrument was not designed for city observations, the city data it has produced are quite limited. Further difficulties have arisen due to factors including clouds, aerosols, and land topographies, which can vary widely between different cities. These issues can be difficult to resolve with the limited resolutions of most atmospheric models that are currently available.
Now, NASA has launched the next iteration of the instrument, OCO-3, which orbits Earth from aboard the International Space Station. Through improvements in engineering, OCO-3 can reliably scan dozens of global cities and take “snapshots” of CO2 being emitted every day while retaining the coverage of its global CO2 measurements. As this important project begins, Dr. Oda’s contributions will likely prove critical to ensuring effective mission planning, early monitoring of data quality, and the development of high-resolution global city emission estimates.
Incorporating NASA’s Black Marble Data
Dr. Oda and his colleagues are now working to create a truly reliable, luminosity-based inventory of greenhouse gas emissions globally, using data gathered by NASA’s Black Marble project, in collaboration with Dr. Miguel Roman, who pioneered NASA’s Black Marble nightlight product. Derived from the Day-Night Band of the Visible Infrared Imaging Radiometer Suite (VIIRS-DNB) instrument onboard Suomi-NPP, Black Marble products are available at 15 arc-second resolution from January 2012 onward and are being processed daily within 3-5 hours after acquisition.
Though the primary purpose of the VIIRS-DNB is to track clouds at night, Black Marble has enabled the use of VIIRS-DNB for monitoring manmade night lights at unprecedented levels of radiometric, spatial, and temporal detail. Compared with previous approaches, it is more effective at identifying variations in brightness arising from natural sources, including clouds, snow, terrain, atmospheric variations, and moonlight.
The quality of Black Marble’s observations allows these sources to be removed from night-time light images, without removing any of the brightness from electrical lights – improving their time and spatial resolutions even further.
For Dr. Oda’s team, this capability provided the opportunity to track emissions changes corresponding to human activities that distinctly vary in time and space, such as differences in energy usage over time as settlements expand, or differences between urban and rural areas. Dr. Oda and his colleagues hope that Black Marble data will enable them to greatly improve city emission estimates, while capturing time variations, and rigorously quantifying any errors and uncertainties.
Dr. Oda plans to combine the new Black Marble-based emission inventory with data collected by NASA’s Earth Observation System fleet of satellites, such as OCO-2 and OCO-3, as well as current and future carbon observing satellites from Japan and Europe, further improving current emission monitoring capability for global cities.
Improving Prospects for Climate Action
Looking further ahead, Dr. Oda now hopes to expand the usage of this advanced data collection technology. Afterward, he aims to establish systems to support emission reporting and monitoring, tailored to the varied requirements and restrictions of individual cities and countries. If achieved, these systems would make it significantly easier for communities to plan out emissions reduction schemes and implement global emission monitoring under the United Nations Framework Convention on Climate Change (UNFCCC) toward Paris Climate Agreement goals.
In the future, emission monitoring support frameworks could be provided to groups including local city councils, giving them access to far more accurate emissions inventories than are currently available. If achieved, this would enable policymakers to precisely pinpoint any prominent sources of emissions in their cities, and subsequently, to set goals to reduce their emissions to net zero.
As a growing number of cities worldwide come to acknowledge the widespread call for rapid CO2 emissions reductions in the coming decade, Dr. Oda’s approach comes at a pivotal moment in our history. Using his techniques, parties who are not specialized in climate science, yet hold the power to make decisions, could soon make meaningful choices about the future development of their cities. Ultimately, they provide a new source of hope that the worst effects of climate change can be avoided and mitigated.
This article is originally published on the Scientia website. Read the original article.
Dr. Tomohiro Oda

Dr. Tomohiro Oda is a senior scientist at Universities Space Research Association (USRA), Maryland. He has a particular research focus on greenhouse gas emissions from human activity, as well as using remote sensing data gathered from Earth observation satellites, such as NASA’s Orbiting Carbon Observatory (OCO) 2 and 3, and Japanese Greenhouse gas Observing Satellites (GOSAT).
Dr. Oda obtained his Masters and Ph.D. in Engineering from Osaka University in Japan and held research and teaching positions at the National Institute for Environmental Studies, Colorado State University/NOAA Earth System Research Lab, and NASA’s Goddard Space Flight Center.
Currently, Dr. Oda serves as Lead of global surface atmospheric flux products at the Earth from Space Institute (EfSI), a newly established program at USRA. In collaboration with space agencies, such as NASA and JAXA, as well as university partners, Dr. Oda continually works to improve his ODIAC emissions model, which is now widely used in carbon cycle modeling and provides Earth observation-based global emission products in support of science and policy applications.
Dr. Oda is an Adjunct Professor at the Department of Atmospheric and Oceanic Science, University of Maryland, College Park, and a Visiting Researcher at the Graduate School of Engineering, Osaka University in Japan, where he enjoys science research and educational activities.
Contact
- Email: toda@usra.edu
- Web: www.odiac.org
- An Innovative Medium-Voltage DC Circuit Breaker for Renewable Power Grids - October 13, 2022
- Scientists are mapping the Earth’s Magnetosphere with Energetic Atoms - September 30, 2022
- Scientists are Developing Recyclable and Self-healing Plastics - August 9, 2022
