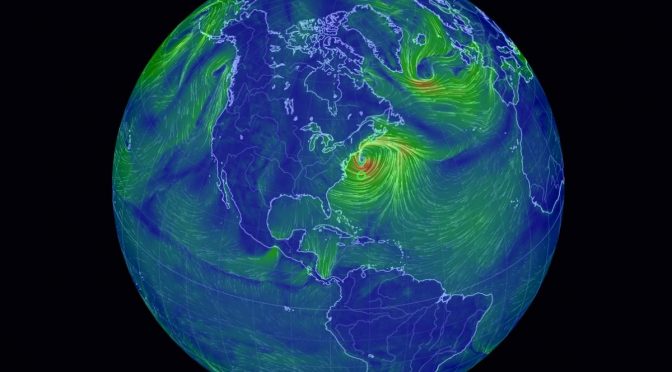
This is so cool! With this tool, called “Earth Wind Map”, an animated map of global wind, weather, and ocean conditions, you can see current wind speeds all over the Earth, in real time!
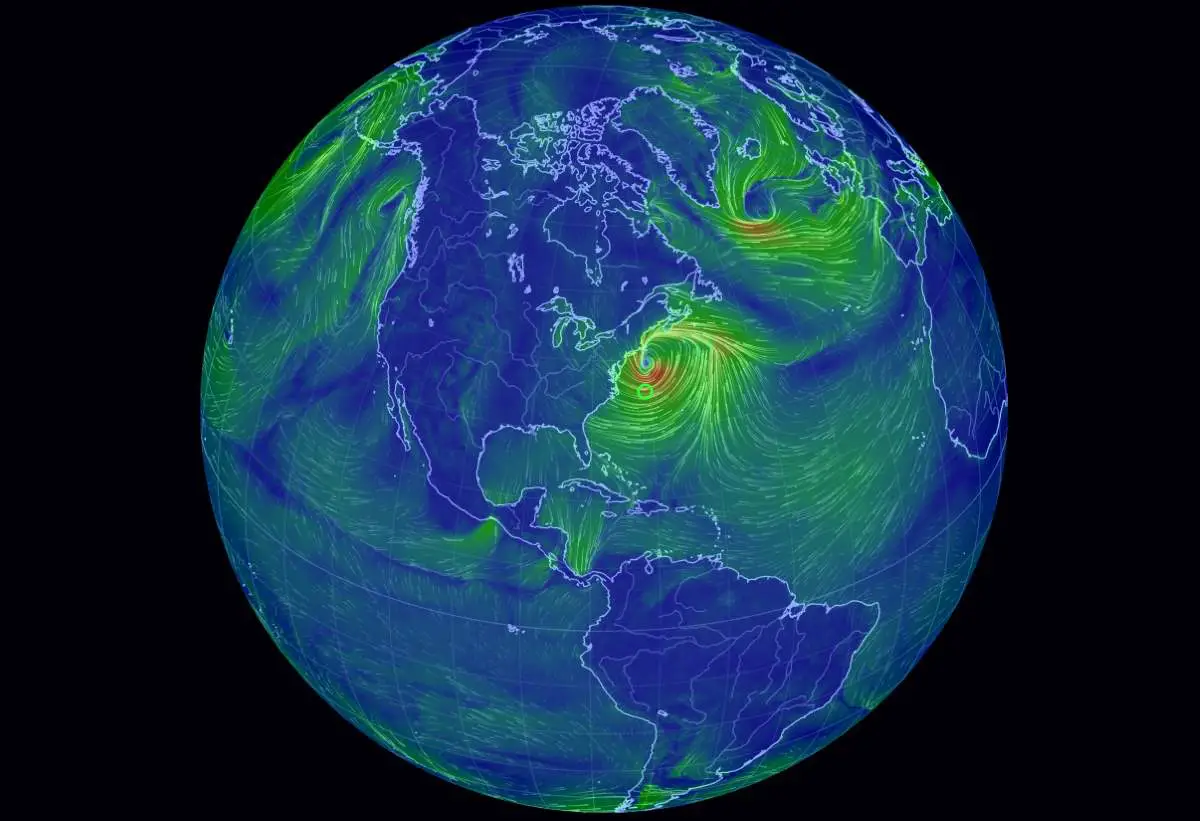
See the tool here.
They have also a Facebook page. They published the animation below, which shows a full, one-year time-lapse animation of surface winds from Jan 1, 2017, to Jan 1, 2018, over the Western Hemisphere. The data come from NWS’s GFS numerical weather model). Blue colors represent slower winds. Greens and yellows are faster winds. Streamlines show the direction of the wind in each frame of the animation.
“Earth” is an open-source project. The source code is available on GitHub.

Related: What Creates the Wind?

I am a software developer and a science enthusiast. I was graduated from the Istanbul Technical University (ITU), Computer Engineering. In the past, I worked at the Istanbul Technical University Science Center as a science instructor. I write about the planet Earth and science on this website, ourplnt.com. I am also an animal lover! I take care of stray cats & dogs. This website's all income goes directly to our furry friends. Please consider supporting me on Patreon, so I can help more animals!
Latest posts by M. Özgür Nevres (see all)
- How Many Elephants are Left in the World in 2025? - August 17, 2025
- Moon Landings: All-Time List [1966-2025] - February 2, 2025
- What Is Max-Q and Why Is It Important During Rocket Launches? - January 16, 2025