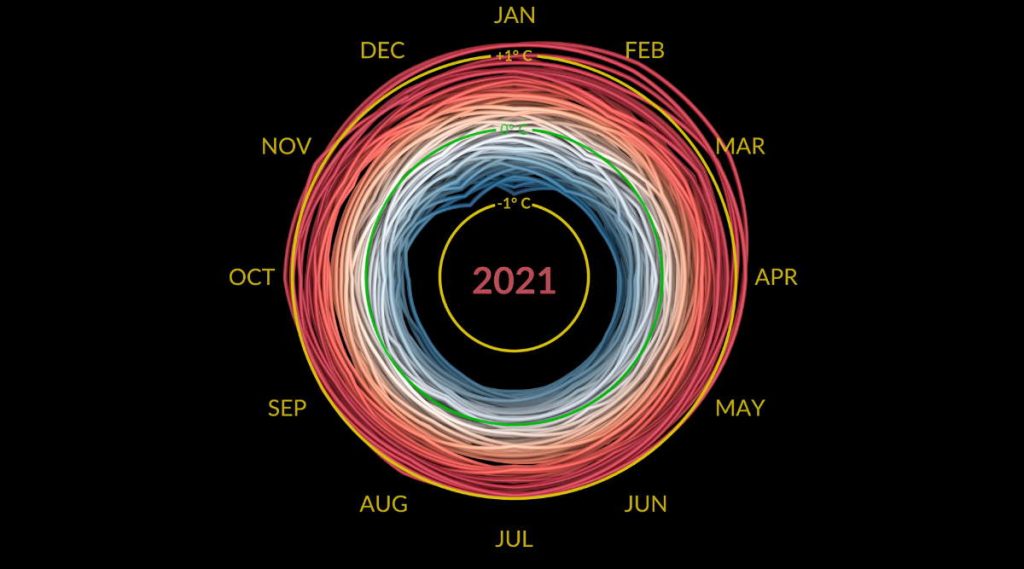
Climate Central channel has put the 116 years history of global warming into a just 34-second video. The result is terrifying.
Global warming is accelerating – that’s a fact. In April 2018, the level of carbon dioxide in Earth’s atmosphere hit the highest point in the last 800,000 years. NASA and NOAA analyses suggest that the long-term global warming trend continued in 2017. This year (2018), on March 17, the Arctic sea ice cover peaked at only 5.59 million square miles (14,478,033.54 km2 or about 5,590,000 square miles), the 2nd lowest max on record (and the lowest max on record was, guess it, in 2017).
25 years of NASA and European satellite data shows that rather than increasing steadily, global sea-level rise has been accelerating in recent decades. Cooler-than-normal years start to become rarer, and by the 1990s, they’ve almost disappeared completely. Climate Central channel has put the 116-year history of global warming (1900-2016) into a just 34-second video. The result is terrifying. The “Temperature Circle” shows every nation on the Earth is now in the red, which means now every year is warmer than normal.
History of Global Warming
The visualization above, which shows the 116-year history of Global Warming is based on the GISS Surface Temperature Analysis (GISTEMP) data (see notes 1).
It is clear that the warming really is global – while there are individual variations in how hot any year is, overall, every country and region in the world is getting warmer and warmer. It’s also clear that global warming is accelerating. In the past three decades, the bars have started pushing further and further from the center and getting redder and redder.
Recent analyses also show that the five warmest years on record all have taken place since 2010. According to NASA data, globally averaged temperatures in 2017 were 1.62 degrees Fahrenheit (0.90 degrees Celsius) warmer than 1951 to 1980 means. As of 2018, the year 2017 is second only to global temperatures in 2016. However, 2017 was the warmest year without an El Niño. Earth’s surface temperatures in 2017 were the second warmest since 1880 when global estimates first became feasible, NASA scientists found.

Notes
- The GISS Surface Temperature Analysis (GISTEMP) is an estimate of global surface temperature change. Research at the NASA Goddard Institute for Space Studies (GISS) emphasizes a broad study of global change, which is an interdisciplinary initiative addressing natural and man-made changes in our environment that occur on various time scales – from one-time forcings such as volcanic explosions to seasonal and annual effects such as El Niño, and on up to the millennia of ice ages – and that affect the habitability of our planet. GISS is located at Columbia University in New York City. The institute is a laboratory in the Earth Sciences Division of NASA’s Goddard Space Flight Center and is affiliated with the Columbia Earth Institute and School of Engineering and Applied Science.
Sources
- “A Century of Global Warming, in Just 35 Seconds” on Scientific American
- GISS Surface Temperature Analysis (GISTEMP) on data.giss.NASA.gov
- Climate Central webpage
- Moon Landings: All-Time List [1966-2025] - February 2, 2025
- What Is Max-Q and Why Is It Important During Rocket Launches? - January 16, 2025
- Top 10 Tallest Rockets Ever Launched [2025 Update] - January 16, 2025

