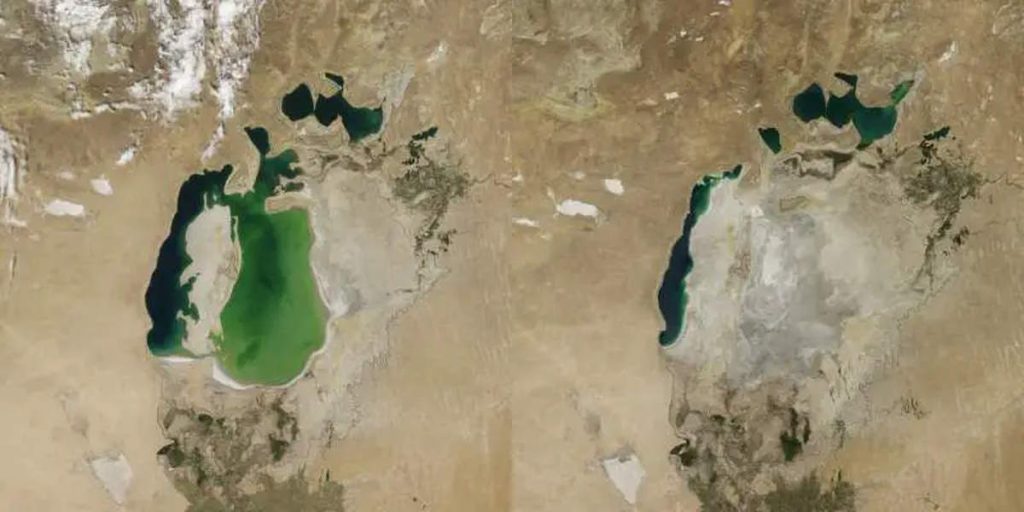
We, humans, changing the Earth – mostly (almost always) in a bad way. Just over the last 25 years, we have destroyed 10% of the Earth’s wilderness. Now, a new world map created by the University of Cincinnati geography professor Tomasz Stepinski shows how the Earth’s surface has dramatically changed between 1992 and 2015.
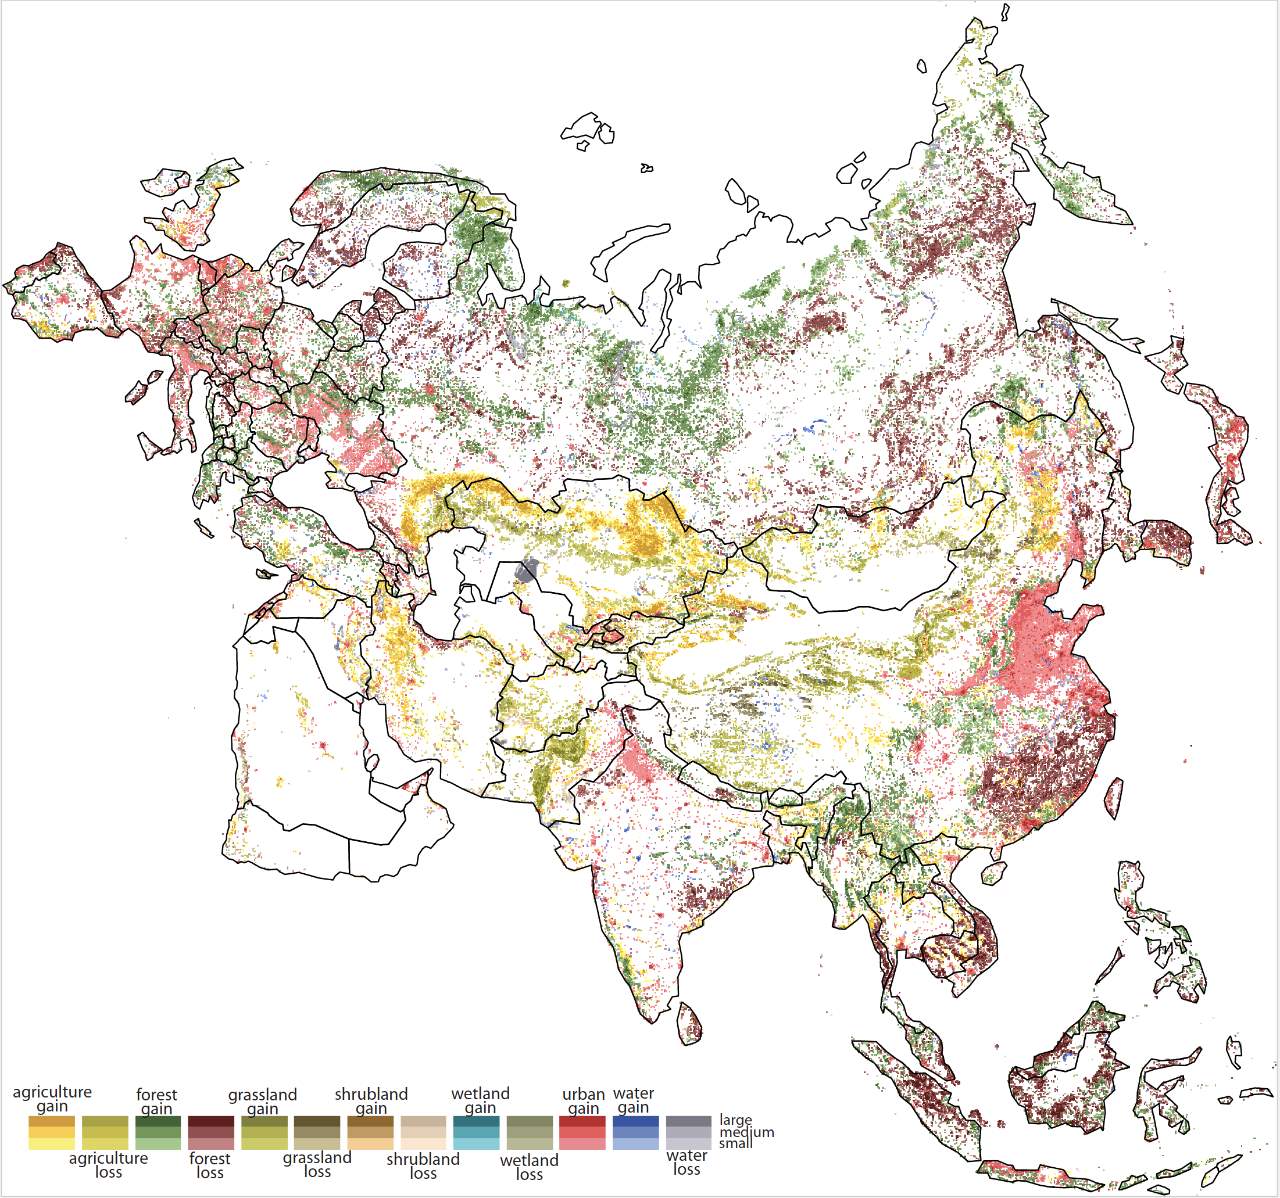
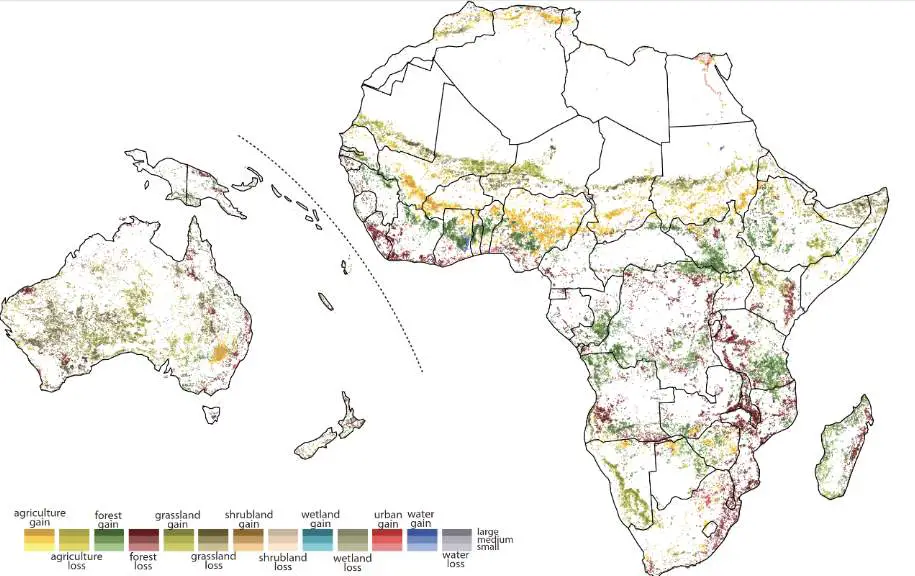
Stepinski created the new world map to better understand the migration patterns across the globe, especially why people leaving Guatemala and Honduras to reach the United States. He used high-resolution satellite images from the European Space Agency and turned them into one of the most detailed looks so far at how people are reshaping the planet. The colorful charts, published on November 15, 2015, on the UC News webpage show the changes in forests, urban areas, agricultural land and wetlands, water gain and loss, and more.
Related: Changing Earth
The map packaged up into 9-kilometer by 9-kilometer (5.6-mile by 5.6
How we are changing the Earth’s surface
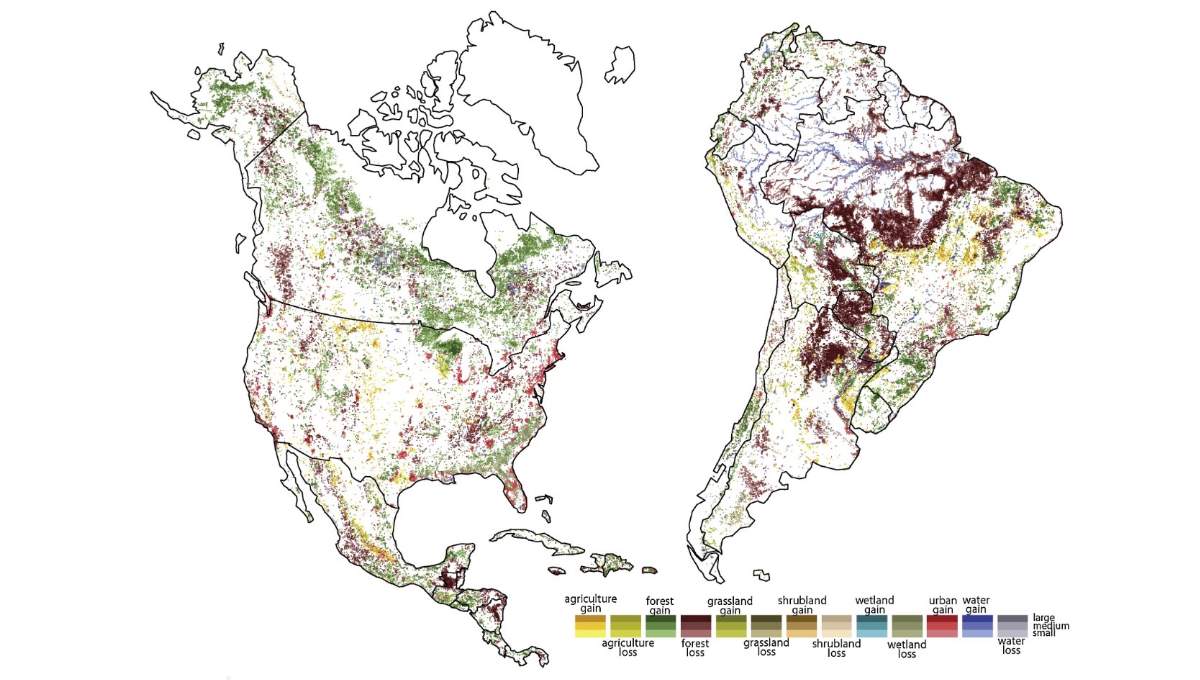
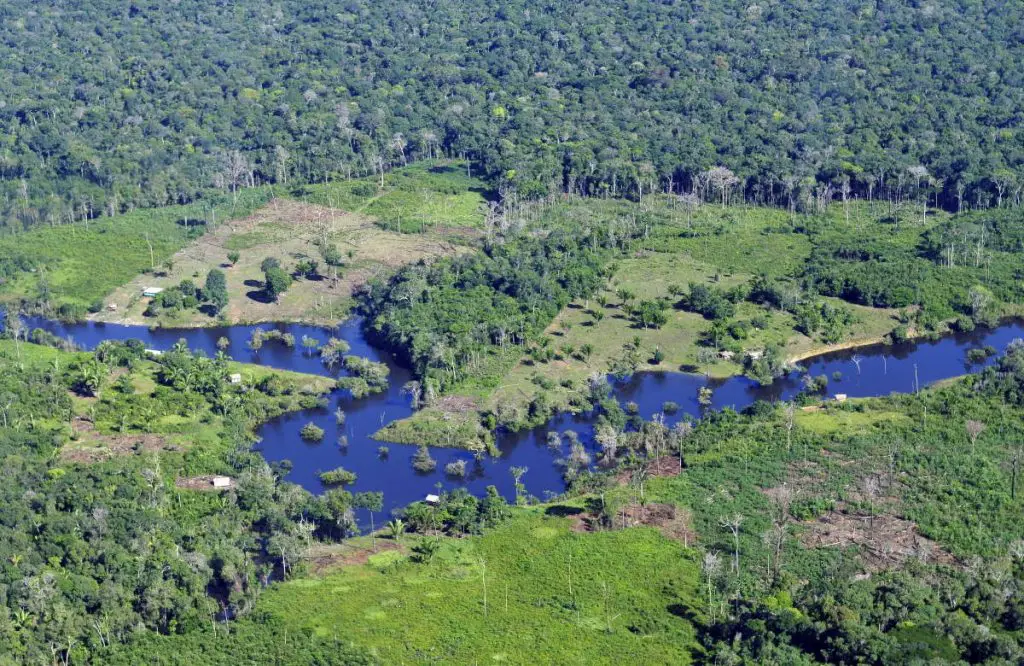
His map shows how Guatemala has seen widespread deforestation, for instance. Stepinsky says “Right now there are caravans of people walking to the United States. Many of them are coming from Guatemala. “And they’ve lost the forest because people use wood for fuel. It’s one part of the refugee crisis.”
He adds: “We already knew about deforestation or wetland loss or increasing urbanization. But now we can see exactly where all of that is happening”.
Since 1992, the European Space Agency is capturing satellite images of the Earth to study climate change. The surface cover can dramatically influence the global temperature depending on whether it absorbs or reflects sunlight. Likewise, forest cover absorbs way more carbon dioxide than u
“The great achievement for the European Space Agency was to make sure the satellite images were compatible from year to year so you could compare them,” Stepinski says.
He also adds the map shows how finite natural resources are being exploited on a global scale, at an alarming pace: “What makes this so depressing is that it’s examining a timescale that is shorter than our lifetime”.
Sources
- “New UC map shows why people flee: Using 24 years of satellite data, the global map helps explain stories such as the Central American migrant caravans” on University of Cincinnati News Webpage
- “Stunning Maps Show How We’ve Changed The Face of Earth Over The Last 25 Years” on Science Alert

- How Many Elephants are Left in the World in 2025? - August 17, 2025
- Moon Landings: All-Time List [1966-2025] - February 2, 2025
- What Is Max-Q and Why Is It Important During Rocket Launches? - January 16, 2025