NASA Climate Change channel has published a video showing the movement of carbon dioxide (CO2) between the air and sea.
From the description of the video:
As Earth warms, it’s important to understand how carbon moves around the planet, including between the air and ocean. Since there are no direct global observations of carbon’s flow between different parts of the planet, scientists use models to provide that information from various indirect data sources.
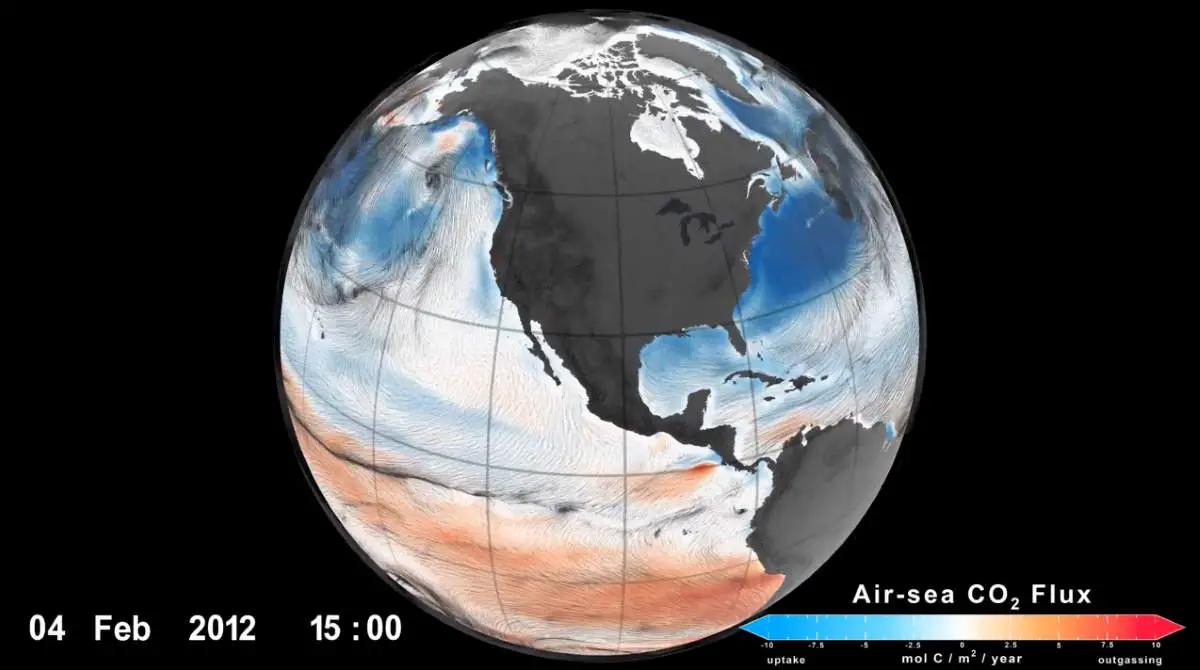
This animation shows results from one such model (the ECCO-Darwin ocean biogeochemistry model). The video shows the movement of carbon dioxide between the air and sea with the help of ocean surface winds from January 3, 2012, to August 15, 2012. Blue colors indicate the ocean’s uptake of CO2, and red colors indicate the ocean’s release of CO2. The pathlines indicate surface winds, which help drive the exchange of CO2 between the atmosphere and the ocean.

The ECCO‐Darwin Data‐Assimilative Global Ocean Biogeochemistry Model
The ECCO-Darwin data‐assimilative global ocean biogeochemistry model estimates seasonal to multi-decadal surface ocean pCO2 and CO2 flux between the air and sea.
ECCO-Darwin is based on a data-constrained, global-ocean, and sea-ice simulation provided by the Estimating the Circulation and Climate of the Ocean (ECCO) Project and an ocean ecosystem component provided by the Darwin Project. Together, ECCO and Darwin provide a time-evolving physical and biological environment for carbon biogeochemistry, which is used to compute surface fluxes of carbon at high spatial and temporal resolution. A more complete description of ECCO-Darwin is available in this StoryMap.
Sources
- “Ocean Surface CO2 Flux with Surface Winds” on the NASA Scientific Visualization website

- How Many Elephants are Left in the World in 2025? - August 17, 2025
- Moon Landings: All-Time List [1966-2025] - February 2, 2025
- What Is Max-Q and Why Is It Important During Rocket Launches? - January 16, 2025