Have you ever wondered what is the budget of NASA? Charting the course of human history, the National Aeronautics and Space Administration (NASA) has turned science fiction into reality since its establishment on July 29, 1958. With an array of incredible feats, from Moon landings to Mars rovers, NASA has continually pushed the boundaries of space exploration. This journey hasn’t been without its costs, however, and the exploration of NASA’s annual budget from its inception to the present day offers a compelling insight into the financial fuel behind these momentous accomplishments. Here’s the budget of NASA, year by year between 1958 and 2024.
2024 NASA Budget
2024 NASA Budget is $24.875 billion
Source: NASA’s FY 2024 Budget, The Planetary Society
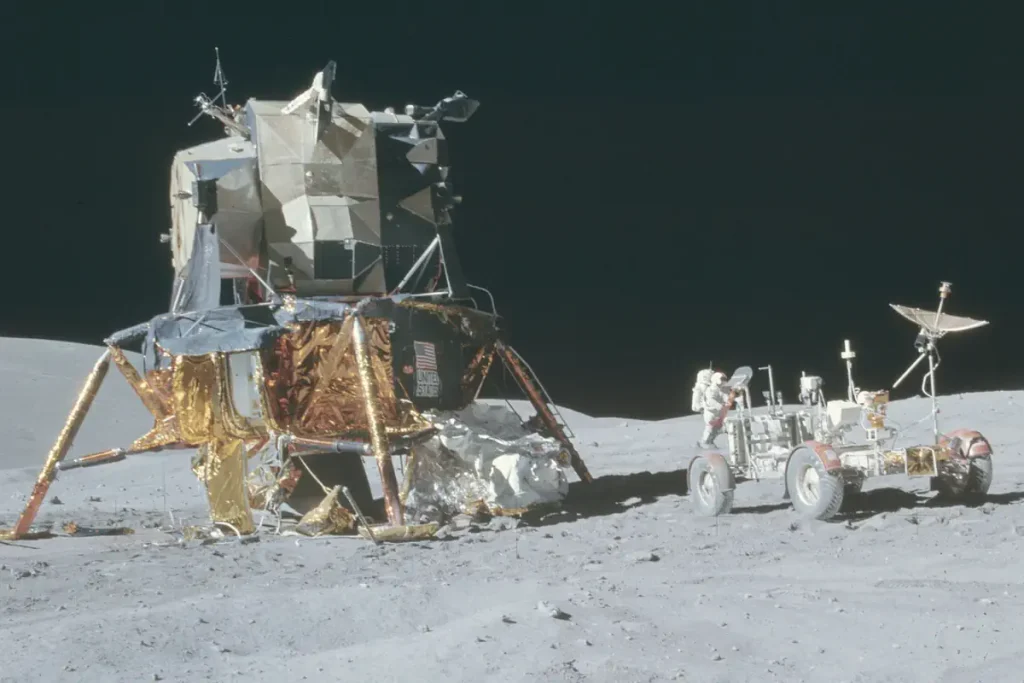
The budget of NASA from 1958 to 2024 [year by year]
The numbers in square brackets [] are the budget of NASA adjusted for inflation (2023 equivalent), and the % of that year’s Fed budget.
2020-2024
- $24.875 billion
- $25.384 billion
- $24.041 billion
- $23.271 billion
- $22.628 billion [$26.559 billion] [0.48%]
2010-2019
- $21.500 billion [$25.622 billion] [0.47%]
- $20.736 billion [$25.160 billion] [0.50%]
- $19.508 billion [$24.249 billion] [0.47%]
- $19.300 billion [$24.507 billion] [0.50%]
- $18.010 billion [$23.150 billion] [0.49%]
- $17.647 billion [$22.712 billion] [0.50%]
- $16.865 billion [$22.059 billion] [0.49%]
- $17.770 billion [$23.583 billion] [0.50%]
- $18.448 billion [$24.987 billion] [0.51%]
- $18.724 billion [$26.162 billion] [0.52%]
2000-2009
- $17.782 billion [$25.258 billion] [0.57%]
- $17.833 billion [$25.236 billion] [0.60%]
- $15.861 billion [$23.307 billion] [0.58%]
- $15.125 billion [$22.860 billion] [0.57%]
- $15.602 billion [$24.340 billion] [0.63%]
- $15.152 billion [$24.442 billion] [0.66%]
- $14.610 billion [$24.198 billion] [0.68%]
- $14.405 billion [$24.402 billion] [0.72%]
- $14.095 billion [$24.254 billion] [0.76%]
- $13.428 billion [$23.758 billion] [0.75%]
1990-1999
- $13.636 billion [$24.940 billion] [0.80%]
- $14.194 billion [$26.533 billion] [0.86%]
- $14.360 billion [$27.255 billion] [0.90%]
- $13.881 billion [$26.967 billion] [0.89%]
- $13.378 billion [$26.750 billion] [0.88%]
- $13.695 billion [$28.153 billion] [0.94%]
- $14.305 billion [$30.172 billion] [1.01%]
- $13.961 billion [$30.312 billion] [1.01%]
- $13.878 billion [$31.045 billion] [1.05%]
- $12.429 billion [$28.986 billion] [0.99%]
1980-1989
- $11,036 billion [$27,126 billion] [0.96%]
- $9,092 billion [$23,423 billion] [0.85%]
- $7,591 billion [$20,358 billion] [0.76%]
- $7,403 billion [$20,577 billion] [0.75%]
- $7.251 billion [$20.542 billion] [0.77%]
- $7.055 billion [$20.690 billion] [0.83%]
- $6.853 billion [$20.964 billion] [0.85%]
- $6.155 billion [$19.433 billion] [0.83%]
- $5.537 billion [$18.557 billion] [0.82%]
- $4.959 billion [$18.338 billion] [0.84%]
1970-1979
- $4.380 billion [$18.388 billion] [0.87%]
- $4.164 billion [$19.452 billion] [0.87%]
- $4.002 billion [$20.122 billion] [0.98%]
- $3.671 billion [$19.656 billion] [0.99%]
- $3.269 billion [$18.510 billion] [0.98%]
- $3.255 billion [$20.110 billion] [1.21%]
- $3.312 billion [$22.732 billion] [1.35%]
- $3.423 billion [$24.933 billion] [1.48%]
- $3.382 billion [$25.444 billion] [1.61%]
- $3.752 billion [$29.437 billion] [1.92%]
1958-1969
- $4.251 billion [$35.320 billion] [2.31%]
- $4.722 billion [$41.373 billion] [2.65%]
- $5.425 billion [$49.572 billion] [3.45%]
- $5.933 billion [$55.715 billion] [4.41%]
- $5.092 billion [$49.232 billion] [4.31%]
- $4.171 billion [$40.976 billion] [3.52%]
- $2.552 billion [$25.398 billion] [2.29%]
- $1.257 billion [$12.661 billion] [1.18%]
- $744 million [$7.586 billion] [0.9%]
- $401 million [$4.130 billion] [0.5%]
- $145 million [$1.516 billion] [0.2%]
- $88 million [$940 million] [0.1%]
Sources
- Your Guide to NASA’s Budget on the Planetary Society website
- A Chronology Of Defining Events in NASA History on the NASA History website
- Budget of NASA on Wikipedia
- Astronautics and Aeronautics, 1986-1990 (Pdf)
- Astronautics and Aeronautics, 1991-1995 (Pdf)
- Moon Landings: All-Time List [1966-2025] - February 2, 2025
- What Is Max-Q and Why Is It Important During Rocket Launches? - January 16, 2025
- Top 10 Tallest Rockets Ever Launched [2025 Update] - January 16, 2025
